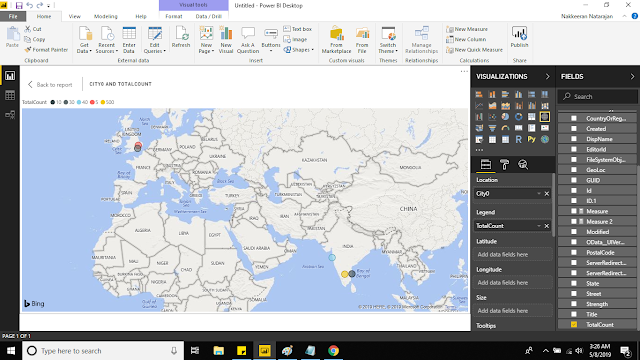
Let us look how to integrate and show the Office 365 SharePoint data on to Power BI reports. In this specific use case, we will look how to SharePoint data as map views.
Consider a very basic scenario of showing organization location-wise user count on Power BI dashboards. So in this case, the organization data is available as SharePoint list, and consider only two parameters, that is location and user count.
The below snapshot shows the data loaded onto Power BI. Let us see step by step approach below.
 |
| PowerBI Report showing the SharePoint List Data as Locations on Map Visualization |


